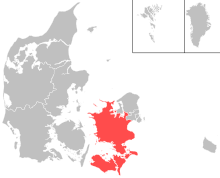
Danish nominating district
Greve nominating district is one of the 92 nominating districts that was created for Danish elections following the 2007 municipal reform.[2][3][4] It consists of Greve and Solrød municipality.[5]
In general elections, the district is a strong area for parties commonly associated with the blue bloc.[6]
General elections results
General elections in the 2020s
2022 Danish general election
| Parties
|
Vote
|
| Votes
|
%
|
+ / -
|
|
|
Social Democrats
|
11,176 |
25.25 |
+1.63
|
|
|
Venstre
|
8,222 |
18.57 |
-12.05
|
|
|
Moderates
|
5,784 |
13.07 |
New
|
|
|
Liberal Alliance
|
4,222 |
9.54 |
+6.90
|
|
|
Green Left
|
3,220 |
7.27 |
+0.48
|
|
|
Denmark Democrats
|
2,715 |
6.13 |
New
|
|
|
Conservatives
|
2,265 |
5.12 |
-2.14
|
|
|
Danish People's Party
|
1,742 |
3.93 |
-6.62
|
|
|
New Right
|
1,653 |
3.73 |
+0.94
|
|
|
Social Liberals
|
1,201 |
2.71 |
-4.24
|
|
|
Red–Green Alliance
|
936 |
2.11 |
-1.34
|
|
|
The Alternative
|
560 |
1.26 |
-0.20
|
|
|
Independent Greens
|
434 |
0.98 |
New
|
|
|
Christian Democrats
|
102 |
0.23 |
-0.56
|
|
|
Lisa Sofia Larsson
|
19 |
0.04 |
New
|
|
|
Rasmus Paludan
|
19 |
0.04 |
New
|
|
|
| Total
|
44,270 |
|
| Source[7]
|
General elections in the 2010s
2019 Danish general election
| Parties
|
Vote
|
| Votes
|
%
|
+ / -
|
|
|
Venstre
|
13,752 |
30.62 |
+6.12
|
|
|
Social Democrats
|
10,606 |
23.62 |
-0.23
|
|
|
Danish People's Party
|
4,739 |
10.55 |
-15.42
|
|
|
Conservatives
|
3,260 |
7.26 |
+4.20
|
|
|
Social Liberals
|
3,123 |
6.95 |
+3.55
|
|
|
Green Left
|
3,048 |
6.79 |
+4.05
|
|
|
Red–Green Alliance
|
1,549 |
3.45 |
-1.27
|
|
|
New Right
|
1,255 |
2.79 |
New
|
|
|
Liberal Alliance
|
1,184 |
2.64 |
-6.41
|
|
|
Stram Kurs
|
995 |
2.22 |
New
|
|
|
The Alternative
|
654 |
1.46 |
-0.86
|
|
|
Klaus Riskær Pedersen Party
|
386 |
0.86 |
New
|
|
|
Christian Democrats
|
355 |
0.79 |
+0.45
|
|
|
Pinki Karin Yvonne Jensen
|
6 |
0.01 |
New
|
|
|
| Total
|
44,912 |
|
| Source[8]
|
2015 Danish general election
| Parties
|
Vote
|
| Votes
|
%
|
+ / -
|
|
|
Danish People's Party
|
11,499 |
25.97 |
+9.40
|
|
|
Venstre
|
10,847 |
24.50 |
-9.54
|
|
|
Social Democrats
|
10,561 |
23.85 |
+4.26
|
|
|
Liberal Alliance
|
4,009 |
9.05 |
+3.20
|
|
|
Red–Green Alliance
|
2,091 |
4.72 |
+0.95
|
|
|
Social Liberals
|
1,506 |
3.40 |
-4.31
|
|
|
Conservatives
|
1,353 |
3.06 |
-2.77
|
|
|
Green Left
|
1,215 |
2.74 |
-3.62
|
|
|
The Alternative
|
1,028 |
2.32 |
New
|
|
|
Christian Democrats
|
149 |
0.34 |
+0.08
|
|
|
Aamer Ahmad
|
19 |
0.04 |
New
|
|
|
Michael Christiansen
|
1 |
0.00 |
New
|
|
|
Bent A. Jespersen
|
0 |
0.00 |
0.00
|
|
|
| Total
|
44,278 |
|
| Source[9]
|
2011 Danish general election
General elections in the 2000s
2007 Danish general election
European Parliament elections results
2024 European Parliament election in Denmark
| Parties
|
Vote
|
| Votes
|
%
|
+ / -
|
|
|
Venstre
|
5,635
|
18.91
|
-10.12
|
|
|
Social Democrats
|
4,805
|
16.13
|
-5.00
|
|
|
Green Left
|
3,619
|
12.15
|
+3.32
|
|
|
Conservatives
|
3,041
|
10.21
|
+3.63
|
|
|
Liberal Alliance
|
2,834
|
9.51
|
+7.14
|
|
|
Danish People's Party
|
2,538
|
8.52
|
-5.53
|
|
|
Moderates
|
2,396
|
8.04
|
New
|
|
|
Social Liberals
|
1,728
|
5.80
|
-2.78
|
|
|
Denmark Democrats
|
1,541
|
5.17
|
New
|
|
|
Red–Green Alliance
|
1,111
|
3.73
|
+0.09
|
|
|
The Alternative
|
546
|
1.83
|
-0.25
|
|
|
| Total
|
29,794 |
|
| Source[12]
|
2019 European Parliament election in Denmark
2014 European Parliament election in Denmark
2009 European Parliament election in Denmark
Referendums
2022 Danish European Union opt-out referendum[16]
| Option
|
Votes
|
%
|
| ✓ YES
|
23,601
|
67.74
|
| X NO
|
11,240
|
32.26
|
2015 Danish European Union opt-out referendum[17]
| Option
|
Votes
|
%
|
| X NO
|
20,041
|
53.10
|
| ✓ YES
|
17,700
|
46.90
|
2014 Danish Unified Patent Court membership referendum[18]
| Option
|
Votes
|
%
|
| ✓ YES
|
18,549
|
64.16
|
| X NO
|
10,361
|
35.84
|
2009 Danish Act of Succession referendum[19]
| Option
|
Votes
|
%
|
| ✓ YES
|
24,158
|
86.18
|
| X NO
|
3,875
|
13.82
|
References

