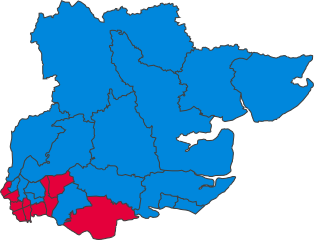
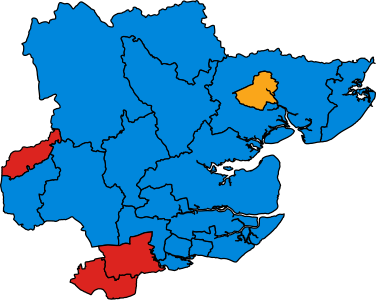
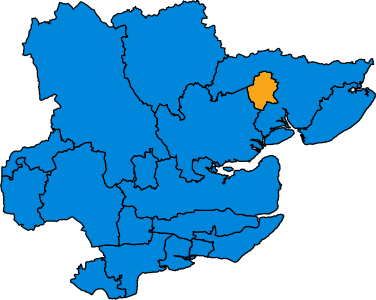
The county of Essex in relation to England The county of Essex unitary authorities of Southend-on-Sea and Thurrock ) is divided into 18 parliamentary constituencies (sub-classified into six of borough type and twelve of county status , affecting the level of expenses permitted and status of returning officer).
The county saw the majority of its population and seats removed on the creation of the county of Greater London in 1965. Since then, the Conservatives have won a majority of the seats in the revised county. In the 2019 general election , all of Essex's seats were won by Conservative MPs by more than 50% of the vote. However, at the 2024 election , the Conservatives were reduced to ten seats, held on significantly reduced majorities. Labour won five seats, Reform UK two seats, and the Liberal Democrats one.[ 1]
Constituencies
Conservative† Labour‡ Liberal Democrat¤ Reform#
Constituency[ nb 1]
Electorate[ 2]
Majority[ 1]
Member of Parliament [ 1] Nearest opposition[ 1]
Map
Basildon and Billericay BC
76,993
20
Richard Holden †
Alex Harrison ‡
Braintree CC
75,662
3,670
James Cleverly †
Matthew Wright ‡
Brentwood and Ongar CC
74,937
5,980
Alex Burghart †
Paul Godfrey #
Castle Point BC
70,923
3,251
Rebecca Harris †
Keiron McGill #
Chelmsford BC
76,454
4,753
Marie Goldman ¤
Vicky Ford †
Clacton CC
75,959
8,405
Nigel Farage #
Giles Watling †
Colchester BC
76,843
8,250
Pam Cox ‡
James Cracknell †
Epping Forest CC
74,553
5,682
Neil Hudson †
Rosalind Doré ‡
Harlow CC
73,479
2,504
Chris Vince ‡
Hannah Ellis †
Harwich and North Essex CC
74,838
1,162
Bernard Jenkin †
Alex Diner ‡
Maldon CC
76,794
6,906
John Whittingdale †
Pamela Walford #
North West Essex CC
76,280
2,610
Kemi Badenoch †
Issy Waite ‡
Rayleigh and Wickford CC
76,422
5,621
Mark Francois †
Grant Randall #
South Basildon and East Thurrock CC
73,322
98
James McMurdock #
Jack Ferguson ‡
Southend East and Rochford CC
70,094
4,027
Bayo Alaba ‡
Gavin Haran †
Southend West and Leigh BC
76,824
1,949
David Burton-Sampson ‡
Anna Firth †
Thurrock BC
73,347
6,474
Jen Craft ‡
Sophie Preston-Hall #
Witham CC
75,064
5,145
Priti Patel †
Rumi Chowdhury ‡
2024 Boundary changes
For the 2023 Periodic Review of Westminster constituencies , which redrew the constituency map ahead of the 2024 United Kingdom general election , the Boundary Commission for England retained the number of constituencies in Essex at eighteen, with minor boundary changes to reflect changes to electoral wards within the county and to bring the electorates within the statutory range. The commission opted to rename Southend West to Southend West and Leigh (although the town of Leigh-on-Sea had already been part of the Southend West constituency prior to the boundary changes), and rename Rochford and Southend East to Southend East and Rochford to acknowledge that Southend-on-Sea had achieved city status during the course of the review.[ 3] Saffron Walden was renamed North West Essex. These changes came into effect from the 2024 general election .
Results history
Primary data source: House of Commons research briefing - General election results from 1918 to 2019[ 4]
2024
The number votes cast for each political party who fielded candidates in constituencies comprising Essex in the 2024 general election were as follows:[ 1]
Party
Votes
%
Change from 2019
Seats
Change from 2019
Conservative
270,382
32.9%
10
Labour
235,891
28.7%
5
Reform
179,977
21.9%
New
2
Liberal Democrats
78,238
9.5%
1
Greens
42,582
5.2%
0
Others
14,054
1.7%
0
Total
821,124
100.0
18
2019
The number of votes cast for each political party who fielded candidates in constituencies comprising Essex in the 2019 general election were as follows:
Party
Votes
%
Change from 2017
Seats
Change from 2017
Conservative
577,118
64.5%
18
0
Labour
189,471
21.2%
0
0
Liberal Democrats
95,078
10.6%
0
0
Greens
20,438
2.3%
0
0
Others
12,502
1.4%
0
0
Total
894,607
100.0
18
Percentage votes
Election year
1974
(Feb)
1974
(Oct)
1979
1983
1987
1992
1997
2001
2005
2010
2015
2017
2019
2024
Conservative
40.3
40.9
52.5
51.9
54.1
53.9
40.3
42.8
46.0
49.2
50.3
58.5
64.5
32.9
Labour
32.9
35.2
28.9
17.8
18.9
23.5
36.4
34.7
28.9
18.6
18.4
29.0
21.2
28.7
Reform
-
-
-
-
-
-
-
-
-
-
-
-
-
21.9
Liberal Democrat 1
26.7
23.8
17.7
29.7
26.6
21.7
18.2
16.7
19.1
21.3
6.7
5.8
10.6
9.5
Green Party
-
-
-
-
*
*
*
*
*
1.0
3.0
1.5
2.3
5.2
UKIP
-
-
-
-
-
-
*
*
*
4.1
20.5
4.6
*
*
Other
-
0.1
0.9
0.6
0.3
1.0
5.0
5.8
6.0
5.8
1.1
0.6
1.4
1.7
1 1974 & 1979 - Liberal Party ; 1983 & 1987 - SDP-Liberal Alliance
* Included in Other
Seats
Election year
1974
(Feb)
1974
(Oct)
1979
1983
1987
1992
1997
2001
2005
2010
2015
2017
2019
2024
Conservative
11
11
12
15
16
15
10
11
13
17
17
18
18
10
Labour
3
3
2
1
0
1
6
5
3
0
0
0
0
5
Reform
-
-
-
-
-
-
-
-
-
-
-
-
-
2
Liberal Democrat 1
0
0
0
0
0
0
1
1
1
1
0
0
0
1
UKIP
-
-
-
-
-
-
0
0
0
0
1
0
0
0
Total
14
14
14
16
16
16
17
17
17
18
18
18
18
18
1 1974 & 1979 - Liberal Party ; 1983 & 1987 - SDP-Liberal Alliance
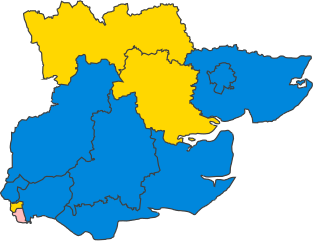
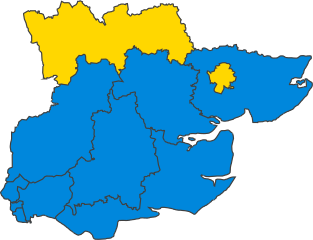
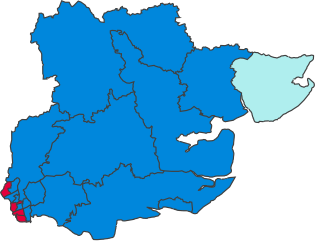
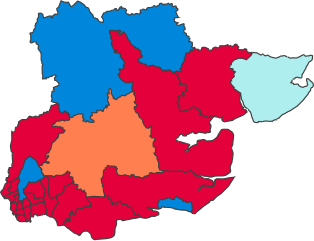
Maps
1885-1910
1885
1886
1892
1895
1900
1906
Jan 1910
Dec 1910
1918-1945
1918
1922
1923
1924
1929
1931
1935
1945
1950-1970
1950
1951
1955
1959
1964
1966
1970
1974-present
Feb 1974
Oct 1974
1979
1983
1987
1992
1997
2001
2005
2010
2015
2017
2019
2024
Historical representation by party
A cell marked → (with a different colour background to the preceding cell) indicates that the previous MP continued to sit under a new party name.
Key: bulk or all of areas marked † form part of present-day Greater London.
1852 to 1885
Conservative Independent Whig Liberal Radical Whig
1885 to 1918
Conservative Independent Labour Independent Labour Party Labour Liberal Liberal-Labour
1918 to 1945
British Socialist (1919-20) / Communist (1920-22) Coalition Liberal (1918-22) / National Liberal (1922-23) Coalition National Democratic & Labour Common Wealth Conservative Constitutionalist Independent Labour Liberal National Liberal (1931-68) National Socialist
1945 to 1974
Common Wealth Conservative Labour Independent Group (1949-50) Labour National Liberal (1931-68)
1974 to 2010
Conservative Independent Labour Liberal Democrats UKIP
2010 to present
Conservative Independent Labour Liberal Democrats Reform UKIP
See also
Notes
^ BC denotes borough constituency, CC denotes county constituency.
References
UK regions and nations English counties Historic counties History of constituency boundaries in By years


