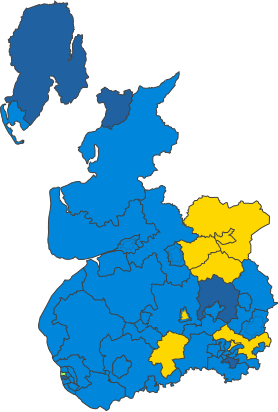
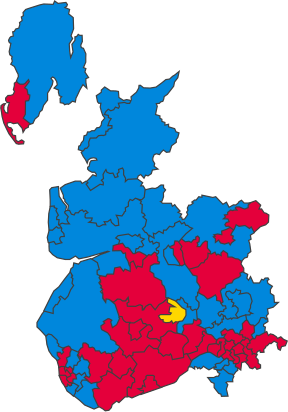
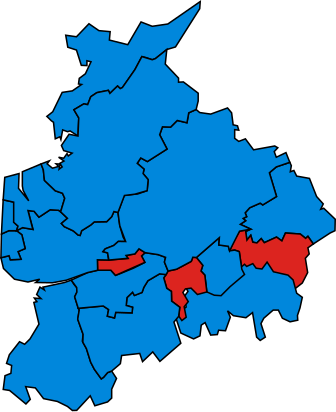
The ceremonial county of Lancashire unitary authorities of Blackburn with Darwen and Blackpool , is divided into sixteen parliamentary constituencies - four borough constituencies and twelve county constituencies . Two seats cross the county boundary - one is shared with Cumbria and one with Merseyside.
Constituencies
† Conservative ‡ Labour The Speaker ±Reform UK ¤Liberal Democrat ¥Green Independent
Constituency[ nb 1]
Electorate[ 1]
Majority[ 2] [ nb 2]
Member of Parliament [ 2] Nearest opposition[ 2]
Map
Blackburn BC
70,586
132
Adnan Hussain (Independent)
Kate Hollern ‡
Blackpool North and Fleetwood BC
75,396
4,647
Lorraine Beavers ‡
Paul Maynard †
Blackpool South BC
76,071
6,868
Chris Webb ‡
Mark Butcher ±
Burnley CC
75,436
3,420
Oliver Ryan ‡
Gordon Birtwistle ¤
Chorley CC
74,568
20,575
Lindsay Hoyle (The Speaker )
Mark Tebbutt ¥
Fylde CC
75,114
561
Andrew Snowden †
Tom Calver ‡
Hyndburn CC
80,617
1,687
Sarah Smith ‡
Sara Britcliffe †
Lancaster and Wyre CC
74,760
9,253
Cat Smith ‡
Peter Cartridge †
Morecambe and Lunesdale CC [ nb 3] 69,254
5,815
Lizzi Collinge ‡
David Morris †
Pendle and Clitheroe CC
65,292
902
Jonathan Hinder ‡
Andrew Stephenson †
Preston BC
55,937
5,291
Mark Hendrick ‡
Michael Lavalette
(Independent)
Ribble Valley CC
77,437
856
Maya Ellis ‡
Nigel Evans †
Rossendale and Darwen CC
73,443
5,628
Andy MacNae ‡
Jake Berry †
South Ribble CC
75,116
6,501
Paul Foster ‡
Katherine Fletcher †
Southport CC [ nb 4] 74,775
5,789
Patrick Hurley ‡
Damien Moore †
West Lancashire CC
73,347
8,336
Ashley Dalton ‡
Mike Prendergast †
Boundary changes
2024
See 2023 Periodic Review of Westminster constituencies for further details
For the 2023 Periodic Review of Westminster constituencies , which redrew the constituency map ahead of the 2024 United Kingdom general election , the Boundary Commission for England opted to combine Lancashire with Cumbria as a sub-region of the North West Region, with the existing seat of Morecambe and Lunesdale extending into southern Cumbria to create a cross-county boundary constituency. Wyre and Preston North was abolished, with its contents being distributed to five neighbouring constituencies. As a consequence, Lancaster and Fleetwood , and Blackpool North and Cleveleys reverted back to the previous names of Lancaster and Wyre , and Blackpool North and Fleetwood respectively. Other proposed changes included the expansion of Pendle to become Pendle and Clitheroe .[ 3] Southport .[ 4] [ 5]
The following constituencies were proposed:
Containing electoral wards from Blackburn with Darwen
Containing electoral wards from Blackpool
Containing electoral wards from Burnley
Containing electoral wards from Chorley
Containing electoral wards from Fylde
Containing electoral wards from Hyndburn
Containing electoral wards from Lancaster
Containing electoral wards from Pendle
Containing electoral wards from Preston
Containing electoral wards from Ribble Valley
Pendle and Clitheroe (part) Containing electoral wards from Rossendale
Hyndburn (part)
Rossendale and Darwen (part) Containing electoral wards from South Ribble
Ribble Valley (part)
South Ribble (part) Containing electoral wards from West Lancashire
Containing electoral wards from Wyre
Blackpool North and Fleetwood (part)
Fylde (part)
Lancaster and Wyre (part)
2010
Under the Fifth Periodic Review of Westminster constituencies , the Boundary Commission for England decided to increase Lancashire's representation from 15 to 16 constituencies, with the creation of Wyre and Preston North CC . Lancaster and Wyre was reconfigured and became Lancaster and Fleetwood , and Blackpool North and Fleetwood became Blackpool North and Cleveleys . Other changes were made to realign constituency boundaries with the boundaries of current local government wards, and to reduce the electoral disparity between constituencies.
Results history
Primary data source: House of Commons research briefing - General election results from 1918 to 2019[ 6]
2024
The number of votes cast for each political party who fielded candidates in constituencies comprising Lancashire in the 2024 general election were as follows:[ nb 5]
Party
Votes
%
Change from 2019
Seats
Change from 2019
Labour
231,808
36.3%
13
Conservative
151,797
23.7%
1
Reform
112,124
17.5%
0
0
Liberal Democrats
38,345
6.0%
0
0
Greens
35,957
5.6%
0
0
Speaker
25,238
3.9%
1
0
Others
44,000
6.9%
1
Total
639,269
100.0
16
Percentage votes
Election year
1983
1987
1992
1997
2001
2005
2010
2015
2017
2019
2024
Labour
29.4
34.4
38.9
49.2
46.7
41.4
35.2
37.8
48.2
37.8
36.3
Conservative
48.2
46.3
45.0
34.2
36.4
35.0
38.7
39.3
45.0
46.2
23.7
Reform
-
-
-
-
-
-
-
-
-
2.3
17.5
Liberal Democrat 1
21.9
18.9
15.2
12.7
13.3
17.0
18.1
4.8
3.7
5.2
6.0
Green Party
-
*
*
*
*
*
0.6
2.7
1.3
2.8
5.6
UKIP
-
-
-
*
*
*
.8
14.3
1.5
*
*
The Speaker 2
-
-
-
-
-
-
-
-
-
3.7
3.9
Other
0.5
0.3
0.9
3.9
3.6
6.5
3.6
1.2
0.3
2.0
6.9
1 1983 & 1987 - SDP-Liberal Alliance
2 Standing in Chorley , unopposed by the 3 main parties.
* Included in Other
Seats
1 1983 & 1987 - SDP-Liberal Alliance
2 Lindsay Hoyle
Maps
1885-1910
1885
1886
1892
1895
1900
1906
Jan 1910
Dec 1910
1918-1945
1918
1922
1923
1924
1929
1931
1935
1945
1950-1979
1950
1951
1955
1959
1964
1966
1970
Feb 1974
Oct 1974
1979
1983-present
1983
1987
1992
1997
2001
2005
2010
2015
2017
2019
Historical representation by party
A cell marked → (with a different colour background to the preceding cell) indicates that the previous MP continued to sit under a new party name.
1885 to 1918
Lancashire area
Conservative Labour Liberal Liberal-Labour Liberal Unionist
Manchester area
Conservative Independent Labour Labour Liberal Liberal-Labour Liberal Unionist
Merseyside area
Conservative Irish Nationalist Labour Liberal Liberal Unionist
1918 to 1950
Lancashire area
Coalition Liberal (1918–1922) / National Liberal (1922–1923) Conservative Constitutionalist Independent Labour Liberal National Labour National Liberal (1931–1968)
Manchester area
Coalition Labour Coalition Liberal (1918-22) / National Liberal (1922-23) Conservative Constitutionalist Independent Labour Labour Independent Group Liberal National Government National Liberal (1931-68)
Merseyside area
Conservative Irish Nationalist Labour Liberal National Labour
1950 to 1983
Lancashire area
Conservative Labour
Manchester area
Conservative Labour Liberal Social Democratic
Merseyside area
Conservative Labour Liberal Social Democratic
1983 to 2010
Conservative Labour Liberal Democrats
2010 to present
Conservative Independent Labour Liberal Democrats Speaker
See also
Notes
^ BC denotes borough constituency, CC denotes county constituency.
^ The majority is the number of votes the winning candidate receives more than their nearest rival.
^ Cross-county constituency with Cumbria
^ Cross-county constituency with Merseyside
^ Lancashire has two cross-county constituencies. Morecambe and Lunesdale lies predominantly in Lancashire, hence is included in the vote shares below. Southport lies predominantly in Merseyside , hence is excluded from the shares below
References
Unitary authorities Boroughs or districts Major settlements Rivers Canals Topics
UK regions and nations English counties Historic counties History of constituency boundaries in By years


